
In-House Programmatic
Ad Tech Cost Optimization: 12 Ways to Cut Spend
Published · Last updated
Next scheduled review:
Ad tech cost optimization starts with a consistent cost boundary. Separate media and platform fees from compute, storage, network traffic and operating work. Measure which resources each workflow consumes, then test changes against latency, reporting quality and advertiser outcomes. A lower infrastructure bill helps only when the buying system still delivers its required service.
Key facts
- A little under half of each dollar does its job. In Q2 2026, 45.1% of programmatic spend in the ANA benchmark reached impressions that were fraud-free, measurable, viewable and not on made-for-advertising sites, up 1.8 points from 43.3% in Q1 2026 (ANA via Fiducia, 6 August 2026). In 2023 the figure was 36 cents (ANA, Programmatic Transparency page, accessed 17 October 2026).
- Fees are about a quarter of spend; quality losses are the rest. The Q3 2025 cost waterfall shows DSP platform fees of 6.0%, DSP data costs of 2.7% and SSP platform fees of 12.8%, leaving seller revenue at 76.2% of spend before non-viewable, non-measurable, invalid and MFA impressions are removed (ANA Benchmark, Q3 2025).
- The UK regulator's estimate is 35p in the pound. The CMA, using 2019 fee data from the major intermediaries, found "publishers receive around 65% of the initial expenditure by advertisers (ie the overall 'adtech take' is around 35 pence from every pound that is spent)" (CMA, Appendix R, 1 July 2020).
- Matched log data finds more tax than vendor-reported fees. ISBA and PwC matched 31 million impressions end to end and found publishers received 51% of advertiser spend, with 15% an "unknown delta" that no intermediary accounted for (ISBA, May 2020). The second study cut the unknown delta to 3% (ISBA, 18 January 2023).
- The same SSP can charge the same publisher anything from 7% to 42%. Adalytics observed one SSP charging "between a 7 and 42% supply fee from different impressions served for a specific publisher", with a median SSP fee of about 20% across most SSPs and outliers "nearly 99%" (Adalytics, April 2022).
- The gap between good and bad buyers is larger than the tax itself. Higher-performing advertisers in the ANA benchmark converted 52.3% of spend into quality impressions in Q2 2026 against 31.1% for the lower cohort, a 21.2-point gap (ANA via Fiducia, 6 August 2026).
Definition
Ad tech cost optimization reduces avoidable fees and operating work while preserving the inventory access, service quality, data controls and business outcomes required by the buying workflow.

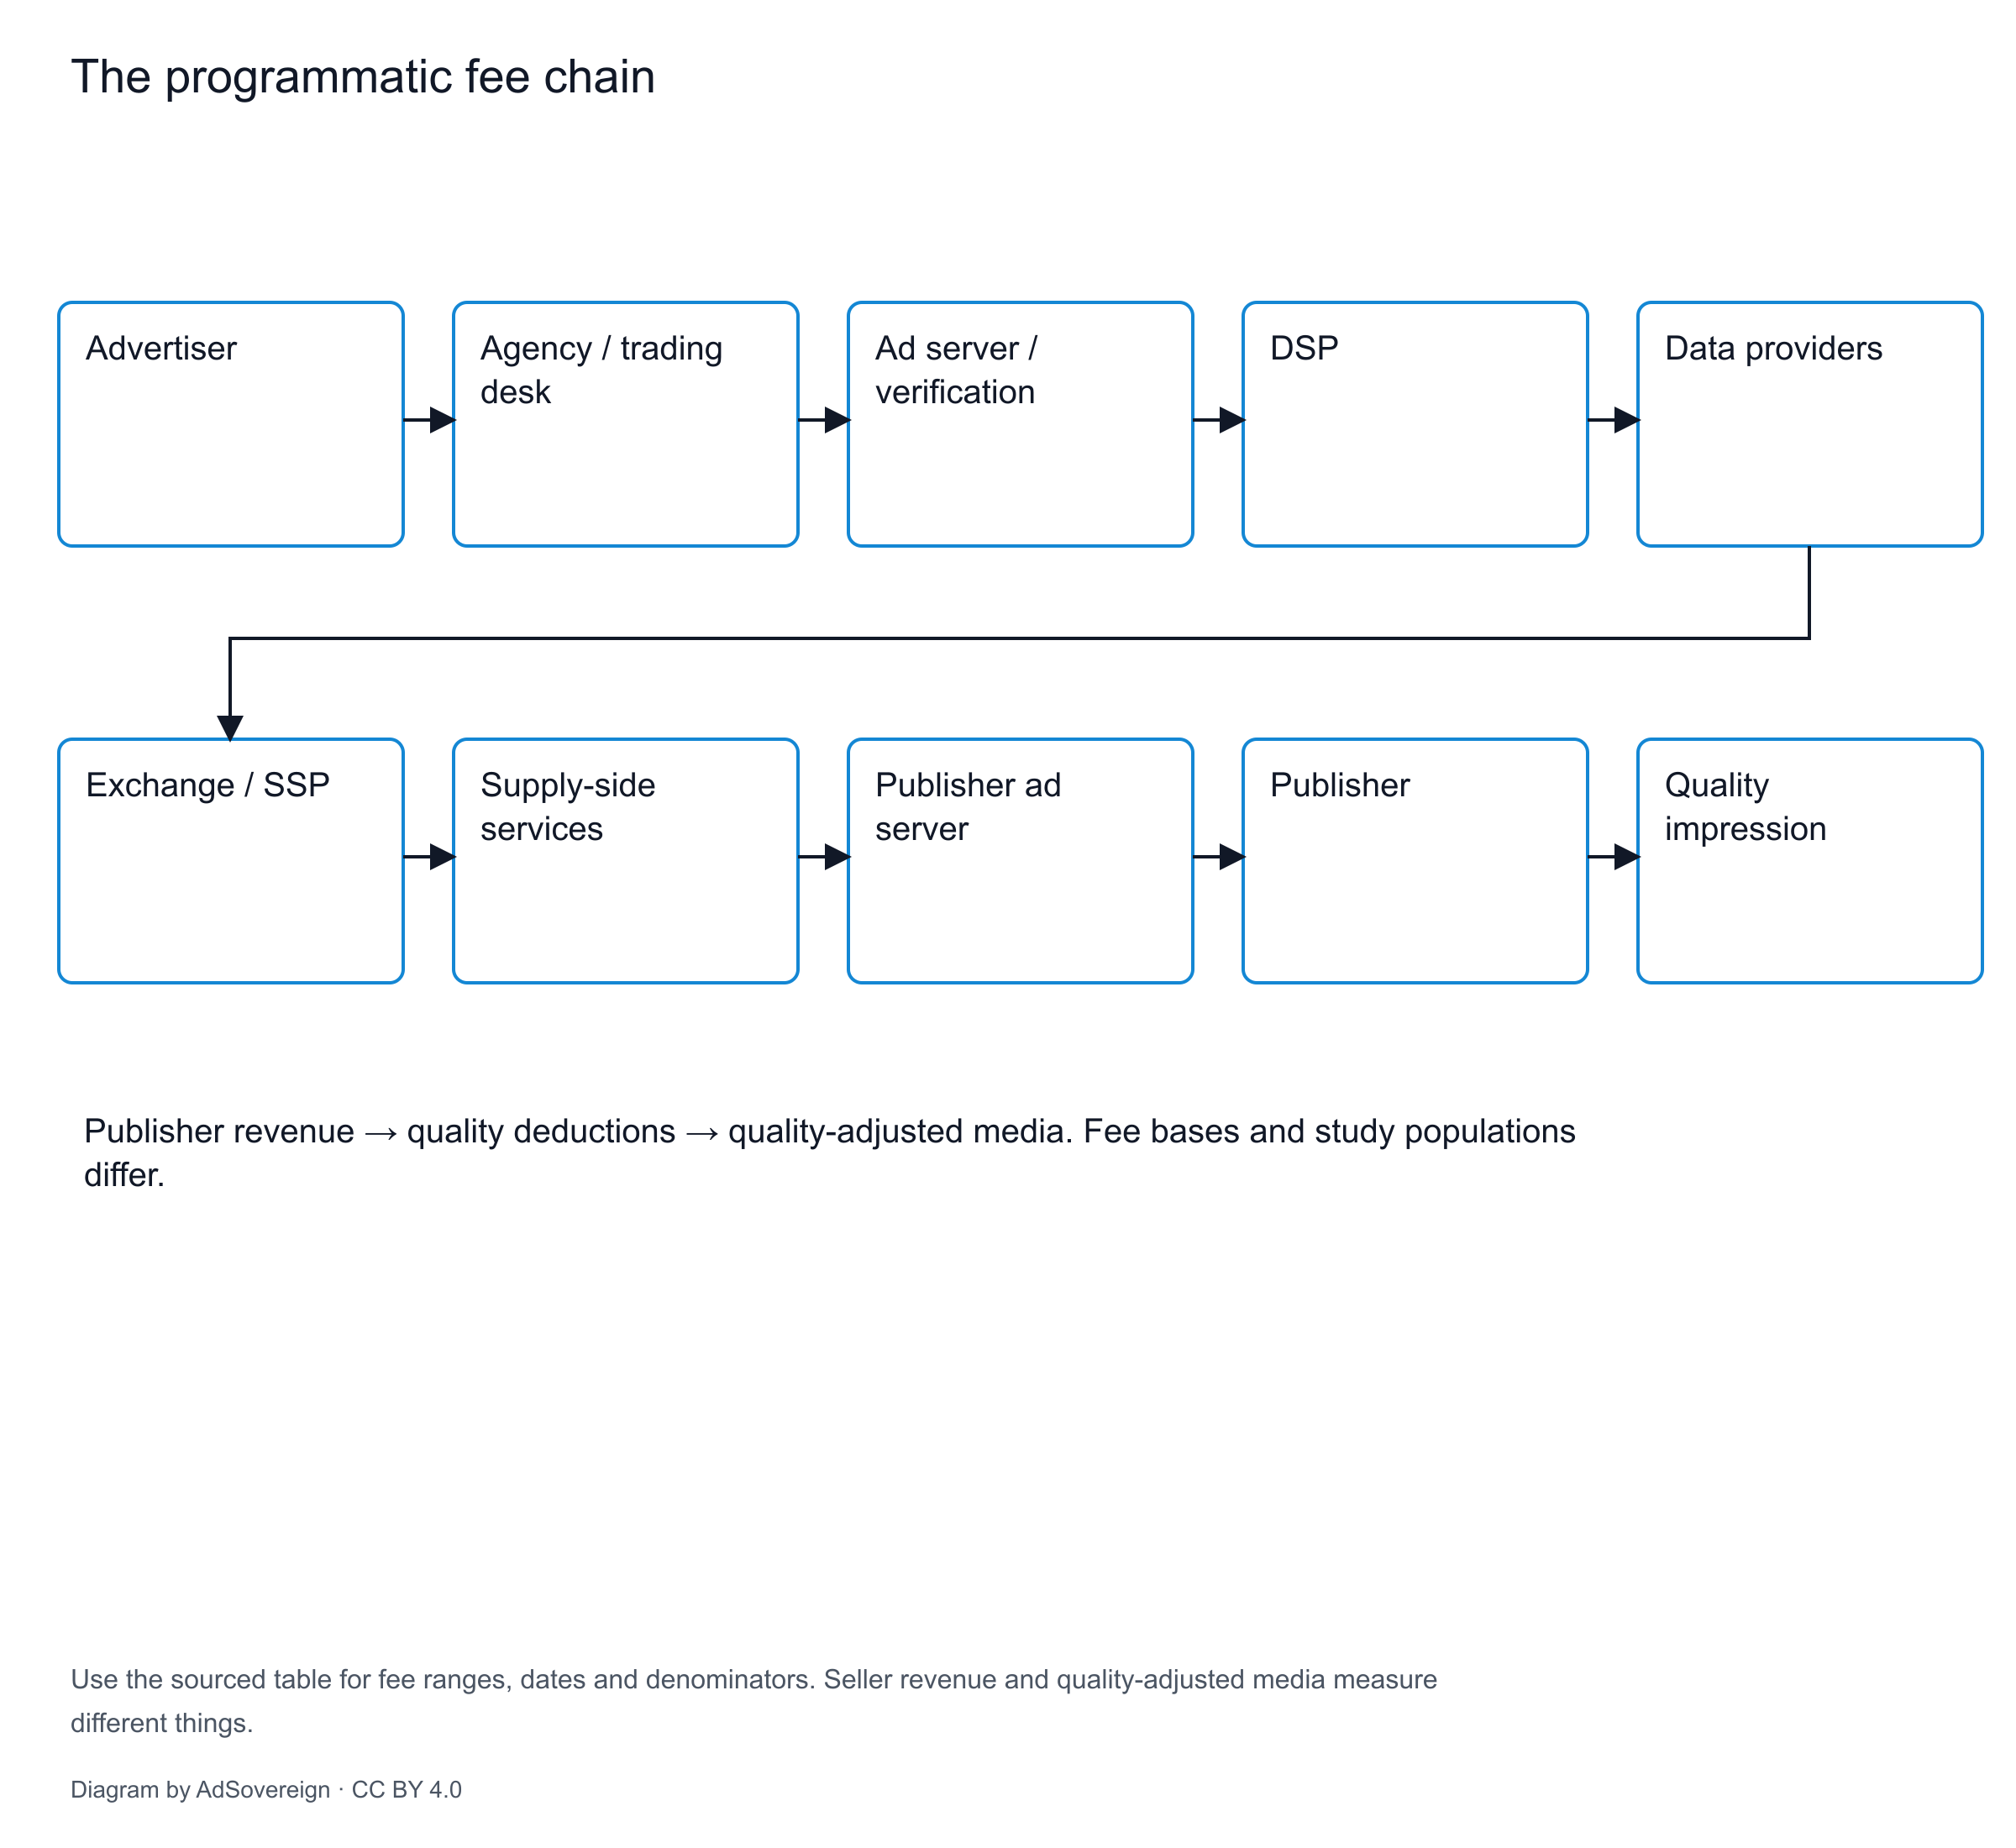
Diagram by AdSovereign, CC BY 4.0.
Evaluate the workflow
Strategy #1: Right-Size Compute Resources
How to Right-Size
- • Use auto-scaling groups to add capacity during traffic surges, remove during lulls
Strategy #2: Optimize Database Queries
Use Read Replicas
Route read-heavy queries (reporting, analytics) to replicas. Keeps primary database free for writes. Reduces need to over-provision primary.
Strategy #3: Implement Multi-Tier Caching
| Cache Tier | Technology | What to Cache | TTL | Hit Rate |
|---|
Strategy #4: Use Spot Instances for Non-Critical Workloads
Workloads Safe for Spot Instances
- ✓ Log processing pipelines: Can re-run if interrupted
- ✓ Batch reporting jobs: Scheduled overnight, non-urgent
- ✓ ML model training: Use checkpointing to resume after termination
- ✓ Test/staging environments: Not production-critical
NOT Suitable for Spot
- ✗ Real-time bid engines: Termination causes bid failures (revenue loss)
- ✗ Primary databases: Interruption = outage
Strategy #5: Compress and archive logs
Choose retention periods from operational and legal requirements. Keep recent diagnostic records accessible, compress records that remain useful and test archive retrieval before moving data. Include retrieval and deletion work in the cost comparison.
Strategy #6: CDN Optimization for Creative Delivery
- • Implement hotlink protection: Prevent other sites from embedding your creatives (steals your bandwidth)
Strategy #7: Reduce Data Transfer Costs
Regional Traffic Containment
Keep EU traffic in EU, US traffic in US (avoid cross-region transfers). Use GeoDNS to route users to nearest datacenter.
Strategy #8: Consolidate Vendor Stack
| Function | Fragmented Approach | Consolidated | Savings |
|---|
Strategy #9: Implement QPS Rate Limiting
Not all bid requests deserve processing. Rate limiting prevents wasted compute on low-value traffic:
- • Geographic filtering: If you don't serve ads in Antarctica, reject those requests instantly
Strategy #10: Filter ineligible bid requests early
Apply eligibility checks before expensive data lookups and scoring where the decision allows it. Record rejection reasons and test that filtering preserves permitted demand and campaign delivery. Measure processing cost and missed opportunities together.
Strategy #11: Match capacity commitments to predictable load
Measure the baseline load before committing to reserved capacity. Compare the commitment term, flexibility and exit cost with the expected workload. Keep a separate plan for bursts and failure conditions instead of sizing a commitment from peak traffic alone.
Strategy #12: Monitor & Alert on Cost Anomalies
FinOps best practice: track costs daily, alert on unusual spikes before they blow the budget.
Cost Monitoring Setup
- • Daily cost reports: Email breakdown by service (compute, storage, network)
- • Resource tagging: Tag instances by team/campaign to attribute costs accurately
- • Tools: AWS Cost Explorer, GCP Billing, CloudHealth, Datadog
ROI Calculator: Combined Savings Impact
Example: 100K QPS DSP with $50K/month infrastructure cost. Applying 8 of 12 strategies:
| Strategy Applied | Monthly Savings |
|---|
Get a Free Infrastructure Cost Audit
Request Cost AuditRead the current references
Read the in house programmatic guide for the broader decision framework.
FAQ
What is the ad tech tax? The share of an advertiser's programmatic spend retained by intermediaries between advertiser and publisher: agency, ad server, DSP, data, verification, exchange or SSP, supply-side services and publisher ad server. The UK CMA estimated it at about 35p in every pound on 2019 data, with publishers receiving about 65% (CMA, Appendix R, 1 July 2020). The ANA's benchmark measured transaction costs at 27.2% of spend in Q2 2026 (ANA via Fiducia, 6 August 2026).
What percentage of programmatic ad spend reaches publishers? Between half and three quarters, depending on the study. ISBA and PwC found 51% in 2020 with a 15% unknown delta (ISBA, May 2020); the CMA found about 65% on 2019 data (CMA, Appendix R, 1 July 2020); the ANA's Q3 2025 waterfall put seller revenue at 76.2% (ANA Benchmark, Q3 2025). The ANA figure excludes agency fees, which is one reason it is highest.
What does working media mean in programmatic? In the ANA benchmark it means spend that bought a TrueImpression: one that is "non-IVT, measurable for viewability, and viewable" (ANA Benchmark, Q1 2025), with made-for-advertising inventory also excluded in the 2026 definition (ANA, 27 May 2026). That was 45.1% of spend in Q2 2026. Other studies use the term for money reaching the publisher, which is a higher number. Agencies use it for the media line of a marketing budget as opposed to fees.
What did the ANA programmatic transparency study find? The 2023 study found that only 36 cents of each dollar entering a DSP reached a consumer, that transaction costs took 29 cents and media productivity losses 35 cents, and that about $22 billion of an $88 billion open-web market was wasted, across 21 advertisers, $123 million and 35.5 billion impressions (ANA, December 2023). The quarterly benchmark that followed reported 43.9% in Q4 2024 (ANA, 12 December 2024) and 45.1% in Q2 2026 (ANA via Fiducia, 6 August 2026).
How do I measure my own ad tech tax? Get direct contracts with your DSP, SSPs and verification vendor, obtain impression-level logs from each, match the records, and build the waterfall from gross spend to quality impressions. ISBA's second study raised its match rate to 58% using a standard data fields list (ISBA, 18 January 2023); the ANA benchmark offers members a continuous version of the same reconciliation (TAG TrustNet, 17 June 2024). The eight steps above are the full method.
How this works on owned infrastructure
AdSovereign provides an enterprise RTB stack for deployment inside a customer’s own infrastructure. Use the architecture to map the relevant components, the security controls to evaluate access and data boundaries, and the pilot to define a bounded evaluation. Compare the operating responsibilities and commercial terms against your own requirements. Infrastructure control does not establish demand access, legal permission or a measured performance improvement on its own.
Sources
- Fiducia, "ANA Programmatic Transparency Benchmark: Q2 2026 Working-Media Efficiency Reaches a Record 45%" (ANA release of 6 August 2026). https://www.fiducia.eco/post/ana-programmatic-transparency-benchmark-q2-2026-working-media-efficiency-reaches-a-record-45
- ANA, "Programmatic Transparency Benchmark: Q2 2026 Benchmark Findings" (26 August 2026, gated). https://www.ana.net/miccontent/show/id/rr-2026-08-programmatic-transparency-benchmark-q2
- ANA, "ANA Programmatic Transparency Benchmark Reveals Widening Gap Between Top and Bottom Advertisers" (27 May 2026). https://www.ana.net/content/show/id/pr-2026-05-programmatic
- ANA, "ANA Introduces Brand Safety & Suitability Metrics, Achieves 99.1% Low-Risk Programmatic Spend" (5 November 2025). https://www.ana.net/content/show/id/pr-2025-11-transparency
- ANA and TAG TrustNet, "Programmatic Transparency Benchmark: Q3 2025 Benchmark Findings" (November 2025). https://s3.amazonaws.com/media.mediapost.com/uploads/Q32025ProgrammaticTransparencyBenchmark.pdf
- ANA and TAG TrustNet, "Programmatic Transparency Benchmark: Q1 2025 Benchmark Findings" (data to 31 March 2025). https://s3.amazonaws.com/media.mediapost.com/uploads/ANAQ12025Programmatic.pdf
- Measured, "ANA Finds $26.8B in Programmatic Waste: What Marketers Can Do Now" (15 August 2025). https://www.measured.com/blog/ana-finds-26-8b-in-programmatic-waste-what-marketers-can-do-now/
- ANA, "ANA Releases 2024 Programmatic Benchmark Study" (12 December 2024). https://www.ana.net/content/show/id/pr-2024-12-programmatic
- ANA, "Programmatic Media Supply Chain Transparency Study: Complete Report" (December 2023). https://www.adslot.com/wp-content/uploads/2023/12/ana-programmatic-media-supply-chain-transparency-study.pdf
- ANA, Media Practice, "Programmatic Transparency" page (accessed 17 October 2026). https://www.ana.net/content/show/id/media-programmatic-transparency
- TAG TrustNet, "ANA, TAG TrustNet Launch Programmatic Transparency Benchmark" (17 June 2024). https://www.tagtoday.net/pressreleases/ana-tag-trustnet-launch-programmatic-transparency-benchmark
- ExchangeWire, Shirley Marschall, "The Ad Tech Toll Road" (16 September 2026). https://www.exchangewire.com/blog/2026/09/16/the-ad-tech-toll-road/
- ISBA and PwC, "Programmatic Supply Chain Transparency Study, executive summary" (May 2020). https://www.isba.org.uk/system/files/media/documents/2020-12/executive-summary-programmatic-supply-chain-transparency-study.pdf
- ISBA, "Second programmatic supply chain transparency study" (18 January 2023). https://www.isba.org.uk/knowledge/second-programmatic-supply-chain-transparency-study
- UK Competition and Markets Authority, "Online platforms and digital advertising market study, Appendix R: fees in the adtech stack" (1 July 2020). https://assets.publishing.service.gov.uk/media/5fe49625e90e071207e10eff/Appendix_R_-_fees_in_the_adtech_stack_WEB.pdf
- Adalytics, "How much in fees are ad tech companies charging publishers & advertisers?" (April 2022). https://adalytics.io/blog/adtech-supply-fees
- AdExchanger, "The Takeaways On Crazy Take Rates" (daily roundup, 14 April 2022). https://www.adexchanger.com/ad-exchange-news/thursday-14042022/
- eMarketer, "eMarketer's New Ad Tech Tax Estimates Show One-Third of Spending Goes to Intermediaries" (August 2019). https://www.emarketer.com/content/emarketer-s-new-ad-tech-tax-estimates-show-one-third-of-spending-goes-to-intermediaries
- AdExchanger, "eMarketer: Ad Tech Gets A Tax Cut As Programmatic Fees Decline" (5 August 2019). https://www.adexchanger.com/analysts/emarketer-ad-tech-gets-a-tax-cut-as-programmatic-fees-decline/
- The Trade Desk, Inc., Form 10-K for fiscal year 2025 (filed February 2026). https://www.sec.gov/Archives/edgar/data/1671933/000167193326000014/ttd-20251231.htm
- PPC Land, "The Trade Desk launches data marketplace overhaul with AI scoring" (29 September 2025). https://ppc.land/the-trade-desk-launches-data-marketplace-overhaul-with-ai-scoring/
- Google, Display & Video 360 Help, "Tips for using third-party audience lists" (accessed 17 October 2026). https://support.google.com/displayvideo/answer/6212219?hl=en
- Microsoft Learn, "Log Level Data Feeds" (updated 22 October 2025). https://learn.microsoft.com/en-us/xandr/log-level-data/log-level-data-feeds
Changelog
October 18, 2026: aligned the approved search title and heading; retained the original publication date.
October 17, 2026: updated search phrasing, source-linked reference context, author and dates. Withheld numerical claims without inline sources.