
In-House Programmatic
Ad Tech Tax Explained 2026: Every Fee, With ANA Numbers
Published · Last updated
Next scheduled review:
The ad tech tax is the share of a programmatic budget kept by intermediaries before it buys an impression. The ANA's benchmark puts transaction costs at 27.2% of spend in Q2 2026, and 45.1% of each dollar reaches a viewable, fraud-free impression (ANA via Fiducia, 6 August 2026). This page maps every fee in the chain with sourced ranges.
It also explains why the studies disagree, what "working media" means in each of them, and how to measure your own path with log-level data.
Key facts
- A little under half of each dollar does its job. In Q2 2026, 45.1% of programmatic spend in the ANA benchmark reached impressions that were fraud-free, measurable, viewable and not on made-for-advertising sites, up 1.8 points from 43.3% in Q1 2026 (ANA via Fiducia, 6 August 2026). In 2023 the figure was 36 cents (ANA, Programmatic Transparency page, accessed 17 October 2026).
- Fees are about a quarter of spend; quality losses are the rest. The Q3 2025 cost waterfall shows DSP platform fees of 6.0%, DSP data costs of 2.7% and SSP platform fees of 12.8%, leaving seller revenue at 76.2% of spend before non-viewable, non-measurable, invalid and MFA impressions are removed (ANA Benchmark, Q3 2025).
- The UK regulator's estimate is 35p in the pound. The CMA, using 2019 fee data from the major intermediaries, found "publishers receive around 65% of the initial expenditure by advertisers (ie the overall 'adtech take' is around 35 pence from every pound that is spent)" (CMA, Appendix R, 1 July 2020).
- Matched log data finds more tax than vendor-reported fees. ISBA and PwC matched 31 million impressions end to end and found publishers received 51% of advertiser spend, with 15% an "unknown delta" that no intermediary accounted for (ISBA, May 2020). The second study cut the unknown delta to 3% (ISBA, 18 January 2023).
- The same SSP can charge the same publisher anything from 7% to 42%. Adalytics observed one SSP charging "between a 7 and 42% supply fee from different impressions served for a specific publisher", with a median SSP fee of about 20% across most SSPs and outliers "nearly 99%" (Adalytics, April 2022).
- The gap between good and bad buyers is larger than the tax itself. Higher-performing advertisers in the ANA benchmark converted 52.3% of spend into quality impressions in Q2 2026 against 31.1% for the lower cohort, a 21.2-point gap (ANA via Fiducia, 6 August 2026).
Definition
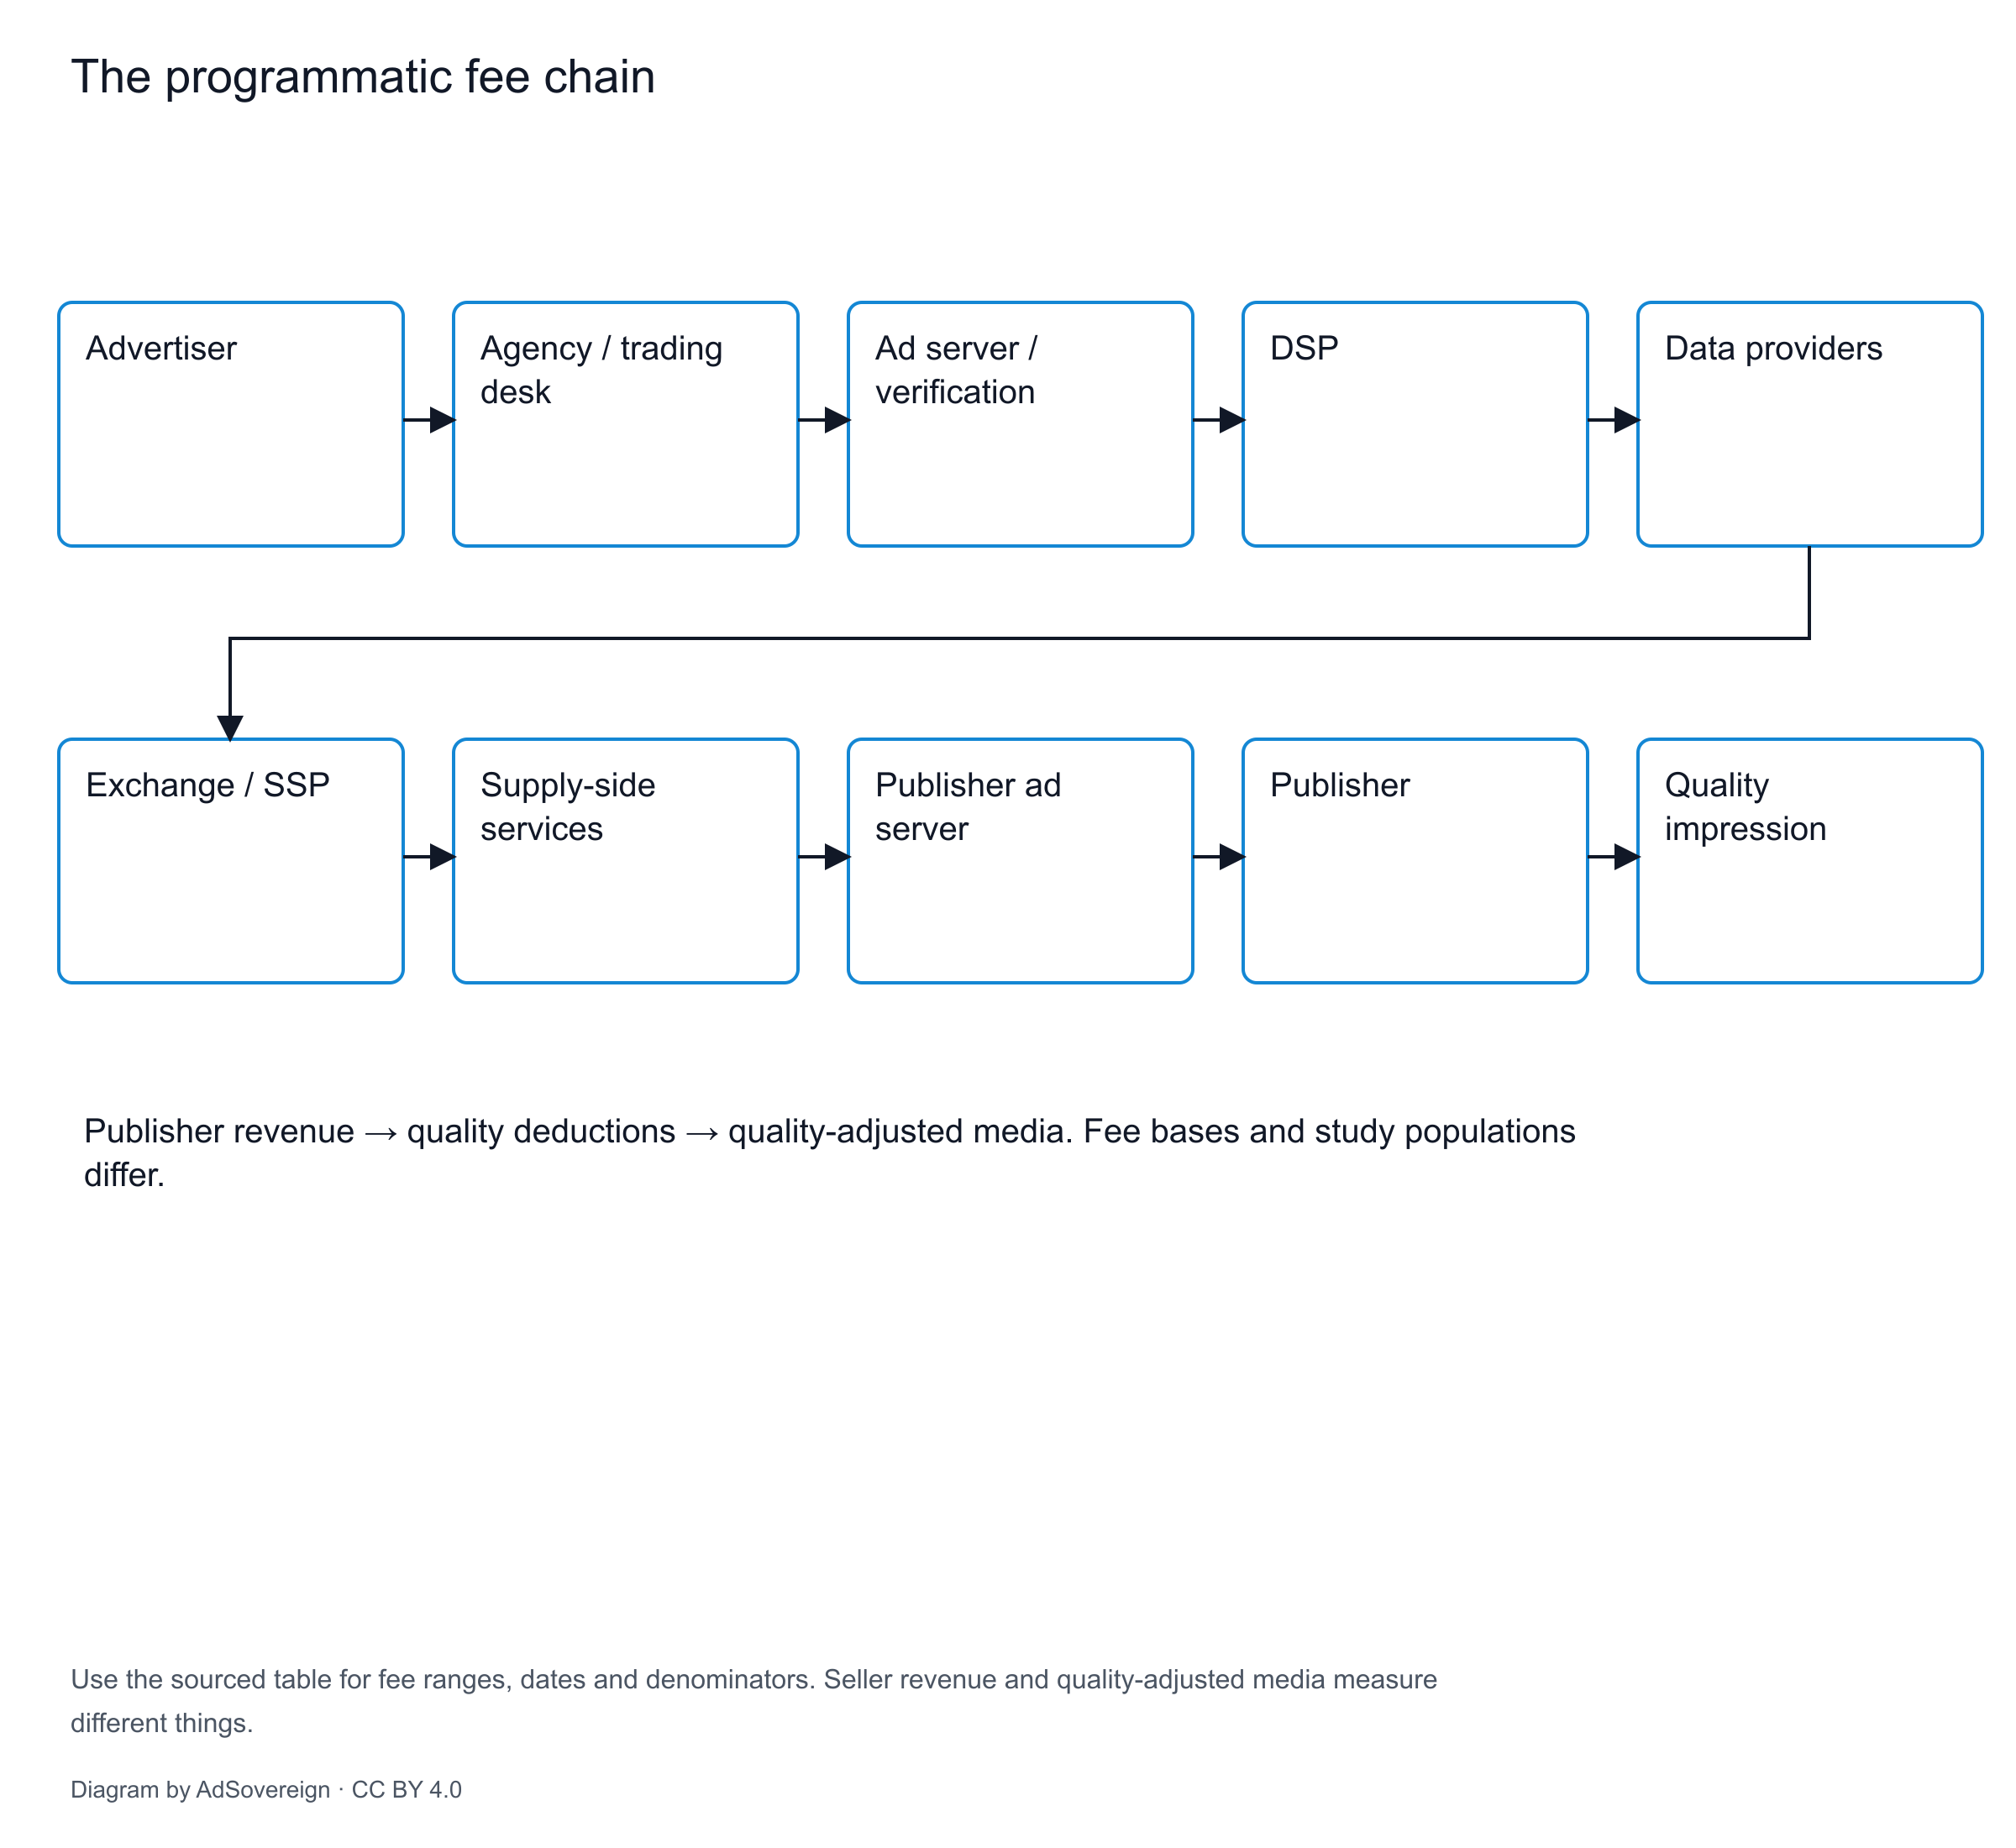
Ad tech tax: the total of fees, margins and spreads retained by intermediaries (agency trading desk, ad server, DSP, data providers, verification vendors, exchange or SSP, supply-side services) between the amount an advertiser pays and the amount a publisher receives for the same impressions, expressed as a percentage of advertiser spend. The CMA notes the fees "are sometimes referred to as the 'adtech tax' or 'take rate'" (CMA, Appendix R, 1 July 2020).
The term is sometimes stretched to include money lost to unviewable, fraudulent or made-for-advertising impressions. Those are not fees; the ANA calls them "loss of media productivity". This page keeps the two apart and shows both.
What "working media" means
Three different things are called working media, and the number changes by ten to thirty points depending on which one a study reports.
Money that reaches the sell side. This is advertiser spend minus buy-side fees (agency, DSP, data, verification) and minus the SSP fee: what the publisher's ad server receives. The ANA calls it "seller revenue" and measured it at 76.2% of spend in Q3 2025 (ANA Benchmark, Q3 2025). The CMA's 65% and ISBA's 51% are the same concept measured on different data (CMA, Appendix R, 1 July 2020; ISBA, May 2020).
Money that buys a quality impression. The ANA's headline metric, TrueAdSpend, is "the ad spending going to TrueImpressions", where a TrueImpression is one that is "non-IVT, measurable for viewability, and viewable" (ANA Benchmark, Q1 2025); the Q1 2026 release describes the index as measuring "programmatic spend delivering fraud-free, measurable, viewable, and MFA-free impressions" (ANA, 27 May 2026). That is the 45.1% figure. It is seller revenue with the wasted impressions removed.
Media versus non-media in the marketing budget. Agencies and finance teams use "working media" to mean the part of the budget that buys media at all, as opposed to fees, production and research. That definition is older and broader and is not what the programmatic studies measure.
When someone quotes a working media percentage, ask which of the three it is. The Working Media Benchmark tracks the ANA series quarter by quarter under the second definition.
The fee chain, hop by hop

Diagram by AdSovereign, CC BY 4.0.
10 of 10 rows
Download JSONTable by AdSovereign, CC BY 4.0.
| Fee for planning and buying; commission, fixed fee or aggregated agency-plus-tech fee | 7% of advertiser spend (ISBA, May 2020) | Excluded from the ANA waterfall: "Agency fees, ad serving fees, managed service fees, and brand safety metrics are not part of the Cost Waterfall" (ANA Benchmark, Q1 2025). Rebates and undisclosed margins are a separate problem; see Executive actions on rebates and kickbacks |
| CPM fees for serving, viewability, fraud and brand-safety measurement | Inside demand-side technology fees of 10% (with data) (ISBA, May 2020) | Vendor rate cards are not public (n/d). The CMA's analysis "does not cover fees charged directly by trading desks or by third-party providers of data or advertising verification services" (CMA, Appendix R, 1 July 2020) |
| Percentage of gross spend, or a spread inside the media price | 8% (ISBA, May 2020); weighted 14%, self-service 4% to 16%, managed 20% to 42% (CMA, Appendix R, 1 July 2020); 6.0% average in the Q3 2025 waterfall (ANA Benchmark, Q3 2025); 21.6% implied at The Trade Desk in 2025 (10-K FY2025) | The spread between the ANA's 6.0% and The Trade Desk's 21.6% reflects mix: the benchmark is dominated by private-marketplace and CTV buys with negotiated fees. Per-platform detail in DSP Pricing Explained 2026 |
| Third-party audience segments, CPM or percent of media; DSP "additional" charges | DSP data 2.7% and DSP additional charges in the Q3 2025 waterfall (ANA Benchmark, Q3 2025); medians of 1.0% data and 4.5% additional in Q1 2025 (ANA Benchmark, Q1 2025); 6.0% data in the 2023 study (ANA Benchmark, Q1 2025); $0.50 to more than $2 CPM list prices (Google DV360 Help, accessed 17 October 2026); "nearly 20%" of media for heavy users (company claim) (PPC Land, 29 September 2025) | The ANA's 2017 study put data at about 9% of spend (CMA, Appendix R, 1 July 2020); the benchmark's decline reflects the shift to first-party and deal-based buying |
| Spend the DSP recorded as paid that no SSP recorded as received | 15% in 2020, 3% in 2022 (ISBA, May 2020; ISBA, 18 January 2023) | ISBA's candidates: "DSP or SSP fees that aren't visible in the study data; post-auction bid shading; post-auction financing arrangements or other trading deals; foreign exchange translations; inventory reselling between tech vendors" (ISBA, May 2020) |
| Revenue share deducted from the publisher's clearing price; higher on open auction than PMP | 8% of advertiser spend, about 14% of publisher revenue (ISBA, May 2020); weighted 16%, range 8% to 25%, AdX 10% to 20% (CMA, Appendix R, 1 July 2020); median about 20%, one SSP 7% to 42%, outliers near 99% (Adalytics, April 2022); 12.8% of spend in the Q3 2025 waterfall, down from 14.7% in Q2 (ANA Benchmark, Q3 2025) | The one hop where the same counterparty charges different rates for the same impression type. The DSP vs SSP explainer covers who pays whom |
| Open Bidding or exchange bidding, curation, supply-side data | About 1% of advertiser spend (exchange bidding at 5% of publisher revenue) (ISBA, May 2020); Open Bidding "typically 5% of the SSP's bid" (CMA, Appendix R, 1 July 2020) | Curation fees sit here and are not yet broken out by any public study (n/d) |
| CPM fee to the publisher | Approximately 0% to 5% of total media spend; one vendor estimates 1% to 2% (CMA, Appendix R, 1 July 2020) | Paid by the publisher, so invisible to the advertiser but still a deduction from the same dollar |
| What is left after hops 1 to 8 | 51% (ISBA, May 2020); about 65% (CMA, Appendix R, 1 July 2020); 62p per £ (Plum via CMA, January 2019); 71% in 2023, 76.2% in Q3 2025 (ANA Benchmark, Q3 2025) | ANA and CMA exclude agency fees; ISBA includes them, which is one reason its publisher share is lowest |
| Seller revenue minus spend on non-viewable, non-measurable, invalid and MFA impressions | 36% in 2023; 43.9% Q4 2024; 41.0% Q1 2025; 37.0% Q2 2025; 39.0% Q3 2025; 43.3% Q1 2026; 45.1% Q2 2026 (ANA Benchmark, Q1 2025; ANA Benchmark, Q3 2025; ANA, 27 May 2026; ANA via Fiducia, 6 August 2026) | Q3 2025 waterfall losses: IVT 0.4%, non-measurable 21.5%, non-viewable 14.8%, MFA 0.5% (ANA Benchmark, Q3 2025) |
Read vertically, the table says that fees (hops 1 to 8) take between 23.8% of spend in the ANA's Q3 2025 waterfall (ANA Benchmark, Q3 2025) and 49% in ISBA's 2020 study (ISBA, May 2020), and that wasted impressions (hop 10) take most of what is left. Read horizontally, every hop has a range rather than a number, because every contract is different and because the counterparties do not publish rate cards. That second fact is why the measurement method at the end of this page matters more than any single figure.
The studies compared
The studies disagree because they measure different things on different data. The table lists each dated public datapoint with its scope.
14 of 14 rows
Download JSONTable by AdSovereign, CC BY 4.0.
ANA, "Programmatic: Seeing through the financial fog" (2017), as summarised by the CMA | 6.6 billion impressions, $36.4 billion, 445 campaigns, 7 advertisers, 2017 | Buy-side charges 28% of spend, including about 9% data (CMA, Appendix R, 1 July 2020) | Not measured | DSP data only; no sell-side fees |
Plum Consulting for DCMS (January 2019) | Expert estimates | Publishers receive 62p of every £1 (CMA, Appendix R, 1 July 2020) | Not measured | Indicative, not transactional |
eMarketer (August 2019) | US forecast model | Nearly one third of US non-social programmatic display spend to intermediaries; fees of $11.6 billion in 2019, forecast $13.4 billion in 2020 and $15.3 billion in 2021 (eMarketer, August 2019; AdExchanger, 5 August 2019) | Not measured | Forecast; excludes agency fees |
ISBA and PwC, study I (May 2020) | 15 advertisers, 12 agencies, 5 DSPs, 6 SSPs, 12 publishers; 267 million impressions, 31 million matched, Q1 2020, UK | Publishers 51%; unknown delta 15% (ISBA, May 2020) | Not measured | Includes agency fees; premium participants, "likely a best case" |
UK CMA (1 July 2020) | 2019 aggregated fee data from major UK intermediaries | Publishers about 65%; adtech take about 35% (CMA, Appendix R, 1 July 2020) | Not measured | Excludes agency, third-party data and verification fees not charged via the DSP |
Adalytics (April 2022) | Log-level data from DSPs, SSPs, exchanges and publishers, US | DSP plus SSP up to 35% on average of a $10 bid; 22% to 45% for half of impressions; SSP median about 20% (Adalytics, April 2022) | Not measured | Excludes CTV and direct-sold; no agency fees |
ISBA and PwC, study II (18 January 2023) | Same design, 2022 data, UK | Unknown delta 3%; match rate 58% (from 12%); publisher share up 8% (ISBA, 18 January 2023) | Not measured | Participants had adopted the ISBA toolkit; "should not be taken as representative" |
ANA, Programmatic Media Supply Chain Transparency Study (June and December 2023) | 21 advertisers, $123 million, 35.5 billion impressions, September 2022 to January 2023, US | Transaction costs 29%; seller revenue 71% (ANA, December 2023) | 36 cents; $22 billion of a $88 billion market wasted (ANA, December 2023) | Web and mobile only; excludes agency, ad serving, managed service fees |
ANA Benchmark, Q4 2024 (12 December 2024) | 37 participating, 21 contributing; 38.5 billion impressions; $235 million; April to September 2024 (ANA Benchmark, Q1 2025) | Transaction costs 29.8% (ANA Benchmark, Q1 2025) | 43.9% (ANA, 12 December 2024) | First benchmark release; CTV partly included |
ANA Benchmark, Q1 2025 | 39 participating, 23 contributing; 41.9 billion impressions; $242 million; November 2024 to March 2025 | Transaction costs 26.1% (ANA Benchmark, Q1 2025) | 41.0% (ANA Benchmark, Q1 2025) | CTV fully included at 30.4% of spend, which raised non-measurable and non-viewable shares |
ANA Benchmark, Q2 2025 | 39 participating, 21 contributing; 18.6 billion impressions; $146 million; April to June 2025 (ANA Benchmark, Q3 2025) | Transaction costs 25.2% (ANA Benchmark, Q3 2025) | 37.0%; waste estimated at $26.8 billion (ANA Benchmark, Q3 2025; Measured, 15 August 2025) | CTV 44.2% of spend |
ANA Benchmark, Q3 2025 (5 November 2025) | 39 participating, 21 contributing; 17.5 billion impressions; $142 million; July to September 2025 | Transaction costs 23.8%; seller revenue 76.2% (ANA Benchmark, Q3 2025) | 39.0% all environments; 47.1% web and mobile (ANA, 5 November 2025) | CTV 45.6%; PMP 81.6%; $13.6 billion recovered since 2023 |
ANA Benchmark, Q1 2026 (27 May 2026) | 86 participating, 66 active | Cohorts differed by 2.4 points on transaction costs (ANA, 27 May 2026) | 43.3%; top cohort 54.0%, bottom 32.1% (ANA, 27 May 2026) | Participant base more than doubled |
ANA Benchmark, Q2 2026 (6 August 2026) | n/d | Transaction costs 27.2% (ANA via Fiducia, 6 August 2026) | 45.1%; top cohort 52.3%, bottom 31.1% (ANA via Fiducia, 6 August 2026) | CTV 41.6%; non-viewable 10.1%; IVT 0.1% |
Why the numbers disagree
Scope. eMarketer, the CMA and the 2017 ANA study counted fees. ISBA counted fees plus an unknown delta. The ANA benchmark counts fees and then wasted impressions. The CMA's 35% take (CMA, Appendix R, 1 July 2020) and the ANA's 54.9% of spend not reaching a quality impression in Q2 2026 (ANA via Fiducia, 6 August 2026) can describe the same chain.
Who is in the sample. ISBA's participants were "the highest profile advertisers, publishers" and the study said its figures were "likely a best case" because only disclosed trading models were included (ISBA, May 2020). The ANA benchmark's participants are ANA members who have fought their suppliers for log access, which is itself a selection effect: in Q3 2025, 39 marketers had asked and 21 had been granted it (ANA Benchmark, Q3 2025).
CTV. When the ANA added connected TV to its waterfall in Q1 2025, TrueAdSpend fell from 43.9% to 41.0% even though transaction costs dropped 3.7 points, because CTV impressions were less measurable and less viewable by the web standard (ANA Benchmark, Q1 2025). The web-and-mobile series (47.1% in Q3 2025) and the all-environment series (39.0%) are different numbers for the same quarter (ANA Benchmark, Q3 2025).
Averages versus medians. The ANA's waterfall uses sequential averages; its detailed findings use medians per metric. The two are not comparable, and the report says so: "Detailed findings should not be compared to the Cost Waterfall" (ANA Benchmark, Q1 2025).
Age. The CMA figures are 2019 data; ISBA I is Q1 2020; Adalytics is 2022. SSP fees in the ANA series fell from 14.7% to 12.8% between Q2 and Q3 2025 alone (ANA Benchmark, Q3 2025). Old figures are still the only public ones for some hops, which is why they are kept here with their dates.
Geography. ISBA, the CMA and Plum are UK; eMarketer, Adalytics and the ANA are US. Fee structures are similar; agency models and the Google share of the chain are not.
The trend, 2017 to 2026
The direction is clear even if the levels are not comparable. Buy-side fees were 28% of spend in the ANA's 2017 data and 23% in the CMA's 2019 data (CMA, Appendix R, 1 July 2020). Transaction costs in the ANA series fell from 29% in 2023 to 23.8% in Q3 2025, then rose to 27.2% in Q2 2026 (ANA Benchmark, Q3 2025; ANA via Fiducia, 6 August 2026). Working media rose from 36% to 45.1% over the same period, mostly because made-for-advertising spend collapsed from 15% of the waterfall in 2023 to under 1% (ANA Benchmark, Q1 2025) and non-viewable spend fell (ANA via Fiducia, 6 August 2026). The ANA's own reading of Q2 2026 is that "pricing efficiency, however, moved the other way" (ANA, 26 August 2026): quality improved, CPMs rose.
The ExchangeWire column that popularised the "toll road" framing in September 2026 drew the same conclusion from the same data: the chain is cleaner than in 2020 but still takes more than half of each dollar before a quality impression is bought (ExchangeWire, 16 September 2026).
How to measure your own path
Industry averages tell you the shape of the problem. Only your own log data tells you the size. The method below is the one the ANA has recommended since 2023 and the one the ISBA toolkit formalised; it is also what the Microsoft Invest exit showed to be necessary for reasons beyond fees.
- Inventory the chain. List every counterparty between your budget and a publisher: agency, ad server, DSP, data providers, verification vendors, SSPs, curators, resellers. The ANA's 2023 participants averaged 16 SSPs and 44,000 domains per campaign (ANA, December 2023); the Q1 2025 median was 19 SSPs and 53,799 domains, with 90.3% of impressions on the top 3,000 (ANA Benchmark, Q1 2025).
- Get direct contracts. The ANA found 52% of brands owned direct DSP contracts, 32% direct SSP contracts and 78% direct verification contracts, and recommended "direct contracts with all primary supply chain partners" (ANA, December 2023). Without a direct contract you cannot demand the logs. The DSP RFP template has the clauses.
- Get log-level data from every hop that has it. DSP, SSP and verification logs at impression level. Expect resistance: half of the ANA's participating marketers had not been granted access in Q3 2025 (ANA Benchmark, Q3 2025), and some DSPs price the feed separately (Microsoft Learn, updated 22 October 2025).
- Match impressions across the logs. Join DSP, SSP and verification records on impression identifiers, timestamps and placement. ISBA's match rate went from 12% to 58% between its two studies once the toolkit's data fields list was adopted (ISBA, 18 January 2023); below that, the unmatched share is your own unknown delta.
- Build the waterfall. Gross spend, minus agency fee, minus DSP fee, minus data, minus verification and ad serving, equals money sent to the sell side; minus SSP fee and supply-side services equals seller revenue; minus spend on invalid, non-measurable, non-viewable and MFA impressions equals TrueAdSpend. Divide spend by quality impressions to get TrueCPM. The ANA's definitions are in its Q1 2025 report (ANA Benchmark, Q1 2025).
- Compare to the benchmark. Put your TrueAdSpend and transaction cost lines next to the ANA series in the Working Media Benchmark. ANA members can join the benchmark itself; it had 86 participating marketers in Q1 2026 (ANA, 27 May 2026).
- Act on the two biggest lines. In every published waterfall the two biggest deductions are the SSP fee and the non-viewable or non-measurable share. Supply path optimization and inclusion lists address the first; the ANA's Q3 2025 SSP fee drop from 14.7% to 12.8% was attributed to "continued progress in supply path optimization" (ANA Benchmark, Q3 2025). Viewability floors and measurable-only buying address the second. The operating levers are in 12 ad tech cost optimization strategies.
- Repeat quarterly. Fees and mixes move; the ANA series moved four points between consecutive quarters more than once. Make the waterfall a standing report, not a project.
The case for owning the data layer that makes steps 3 to 5 routine, rather than negotiating for it each contract, is made in The real cost of cloud DSPs and data ownership and why brands are bringing programmatic in-house. The in-house programmatic hub collects the series; the build option is in How to Build a DSP in 2026.
FAQ
What is the ad tech tax? The share of an advertiser's programmatic spend retained by intermediaries between advertiser and publisher: agency, ad server, DSP, data, verification, exchange or SSP, supply-side services and publisher ad server. The UK CMA estimated it at about 35p in every pound on 2019 data, with publishers receiving about 65% (CMA, Appendix R, 1 July 2020). The ANA's benchmark measured transaction costs at 27.2% of spend in Q2 2026 (ANA via Fiducia, 6 August 2026).
What percentage of programmatic ad spend reaches publishers? Between half and three quarters, depending on the study. ISBA and PwC found 51% in 2020 with a 15% unknown delta (ISBA, May 2020); the CMA found about 65% on 2019 data (CMA, Appendix R, 1 July 2020); the ANA's Q3 2025 waterfall put seller revenue at 76.2% (ANA Benchmark, Q3 2025). The ANA figure excludes agency fees, which is one reason it is highest.
What does working media mean in programmatic? In the ANA benchmark it means spend that bought a TrueImpression: one that is "non-IVT, measurable for viewability, and viewable" (ANA Benchmark, Q1 2025), with made-for-advertising inventory also excluded in the 2026 definition (ANA, 27 May 2026). That was 45.1% of spend in Q2 2026. Other studies use the term for money reaching the publisher, which is a higher number. Agencies use it for the media line of a marketing budget as opposed to fees.
What did the ANA programmatic transparency study find? The 2023 study found that only 36 cents of each dollar entering a DSP reached a consumer, that transaction costs took 29 cents and media productivity losses 35 cents, and that about $22 billion of an $88 billion open-web market was wasted, across 21 advertisers, $123 million and 35.5 billion impressions (ANA, December 2023). The quarterly benchmark that followed reported 43.9% in Q4 2024 (ANA, 12 December 2024) and 45.1% in Q2 2026 (ANA via Fiducia, 6 August 2026).
How do I measure my own ad tech tax? Get direct contracts with your DSP, SSPs and verification vendor, obtain impression-level logs from each, match the records, and build the waterfall from gross spend to quality impressions. ISBA's second study raised its match rate to 58% using a standard data fields list (ISBA, 18 January 2023); the ANA benchmark offers members a continuous version of the same reconciliation (TAG TrustNet, 17 June 2024). The eight steps above are the full method.
How this works on owned infrastructure
Every step in the measurement method depends on getting impression-level logs out of systems that belong to someone else. AdSovereign is an enterprise RTB stack (DSP, SSP, exchange, DMP and clean room) deployed on the advertiser's own infrastructure, so the bid, win, impression and fee records for every transaction are written to the advertiser's warehouse as a by-product of bidding, the waterfall is a query rather than a negotiation, and the DSP platform fee line is a fixed license instead of a percentage of spend. SSP fees on third-party supply and data fees remain, and are visible per impression. The architecture page describes the logging path; the TCO calculator models the fee lines against your own spend; the pilot page describes a 60-day evaluation. This page stays neutral; the product is mentioned only here.
Sources
- Fiducia, "ANA Programmatic Transparency Benchmark: Q2 2026 Working-Media Efficiency Reaches a Record 45%" (ANA release of 6 August 2026). https://www.fiducia.eco/post/ana-programmatic-transparency-benchmark-q2-2026-working-media-efficiency-reaches-a-record-45
- ANA, "Programmatic Transparency Benchmark: Q2 2026 Benchmark Findings" (26 August 2026, gated). https://www.ana.net/miccontent/show/id/rr-2026-08-programmatic-transparency-benchmark-q2
- ANA, "ANA Programmatic Transparency Benchmark Reveals Widening Gap Between Top and Bottom Advertisers" (27 May 2026). https://www.ana.net/content/show/id/pr-2026-05-programmatic
- ANA, "ANA Introduces Brand Safety & Suitability Metrics, Achieves 99.1% Low-Risk Programmatic Spend" (5 November 2025). https://www.ana.net/content/show/id/pr-2025-11-transparency
- ANA and TAG TrustNet, "Programmatic Transparency Benchmark: Q3 2025 Benchmark Findings" (November 2025). https://s3.amazonaws.com/media.mediapost.com/uploads/Q32025ProgrammaticTransparencyBenchmark.pdf
- ANA and TAG TrustNet, "Programmatic Transparency Benchmark: Q1 2025 Benchmark Findings" (data to 31 March 2025). https://s3.amazonaws.com/media.mediapost.com/uploads/ANAQ12025Programmatic.pdf
- Measured, "ANA Finds $26.8B in Programmatic Waste: What Marketers Can Do Now" (15 August 2025). https://www.measured.com/blog/ana-finds-26-8b-in-programmatic-waste-what-marketers-can-do-now/
- ANA, "ANA Releases 2024 Programmatic Benchmark Study" (12 December 2024). https://www.ana.net/content/show/id/pr-2024-12-programmatic
- ANA, "Programmatic Media Supply Chain Transparency Study: Complete Report" (December 2023). https://www.adslot.com/wp-content/uploads/2023/12/ana-programmatic-media-supply-chain-transparency-study.pdf
- ANA, Media Practice, "Programmatic Transparency" page (accessed 17 October 2026). https://www.ana.net/content/show/id/media-programmatic-transparency
- TAG TrustNet, "ANA, TAG TrustNet Launch Programmatic Transparency Benchmark" (17 June 2024). https://www.tagtoday.net/pressreleases/ana-tag-trustnet-launch-programmatic-transparency-benchmark
- ExchangeWire, Shirley Marschall, "The Ad Tech Toll Road" (16 September 2026). https://www.exchangewire.com/blog/2026/09/16/the-ad-tech-toll-road/
- ISBA and PwC, "Programmatic Supply Chain Transparency Study, executive summary" (May 2020). https://www.isba.org.uk/system/files/media/documents/2020-12/executive-summary-programmatic-supply-chain-transparency-study.pdf
- ISBA, "Second programmatic supply chain transparency study" (18 January 2023). https://www.isba.org.uk/knowledge/second-programmatic-supply-chain-transparency-study
- UK Competition and Markets Authority, "Online platforms and digital advertising market study, Appendix R: fees in the adtech stack" (1 July 2020). https://assets.publishing.service.gov.uk/media/5fe49625e90e071207e10eff/Appendix_R_-_fees_in_the_adtech_stack_WEB.pdf
- Adalytics, "How much in fees are ad tech companies charging publishers & advertisers?" (April 2022). https://adalytics.io/blog/adtech-supply-fees
- AdExchanger, "The Takeaways On Crazy Take Rates" (daily roundup, 14 April 2022). https://www.adexchanger.com/ad-exchange-news/thursday-14042022/
- eMarketer, "eMarketer's New Ad Tech Tax Estimates Show One-Third of Spending Goes to Intermediaries" (August 2019). https://www.emarketer.com/content/emarketer-s-new-ad-tech-tax-estimates-show-one-third-of-spending-goes-to-intermediaries
- AdExchanger, "eMarketer: Ad Tech Gets A Tax Cut As Programmatic Fees Decline" (5 August 2019). https://www.adexchanger.com/analysts/emarketer-ad-tech-gets-a-tax-cut-as-programmatic-fees-decline/
- The Trade Desk, Inc., Form 10-K for fiscal year 2025 (filed February 2026). https://www.sec.gov/Archives/edgar/data/1671933/000167193326000014/ttd-20251231.htm
- PPC Land, "The Trade Desk launches data marketplace overhaul with AI scoring" (29 September 2025). https://ppc.land/the-trade-desk-launches-data-marketplace-overhaul-with-ai-scoring/
- Google, Display & Video 360 Help, "Tips for using third-party audience lists" (accessed 17 October 2026). https://support.google.com/displayvideo/answer/6212219?hl=en
- Microsoft Learn, "Log Level Data Feeds" (updated 22 October 2025). https://learn.microsoft.com/en-us/xandr/log-level-data/log-level-data-feeds